Quartz creates visualizations — charts, mostly — of data so quickly off the news cycle. The answer involved an in-house tool that made it relatively simple to turn a data set into a chart that fit Quartz’ visual aesthetic.
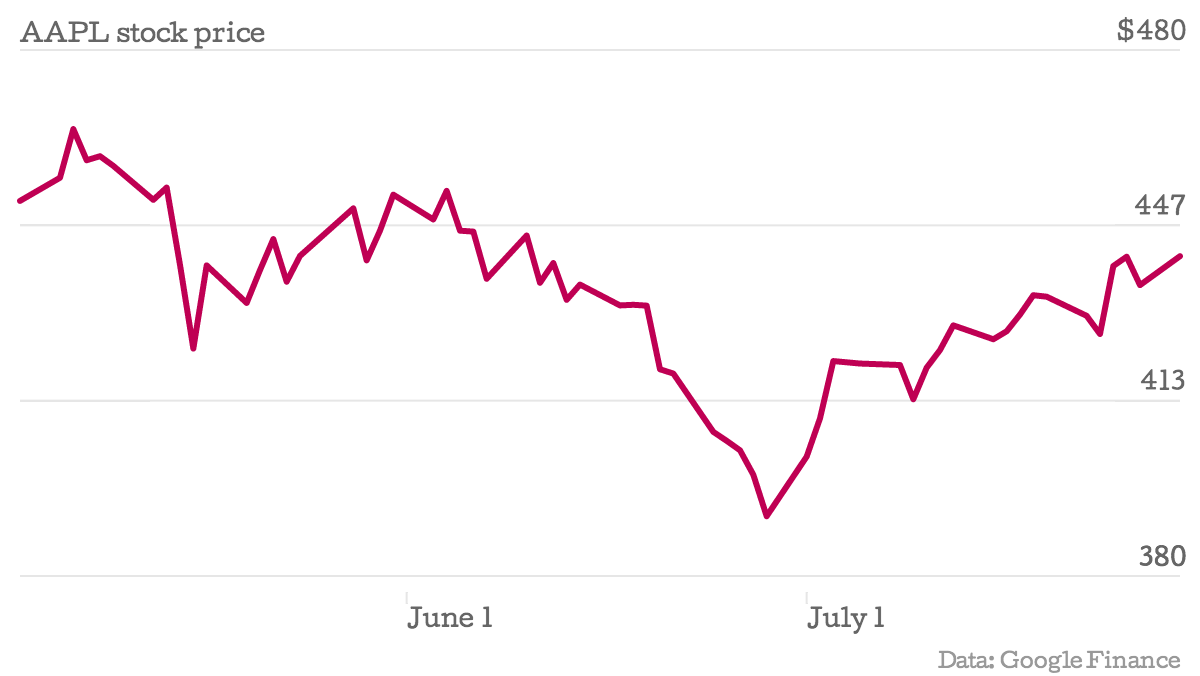
I was very happy, when tweeting with that tool’s creator, David Yanofsky, to learn that Quartz planned on open-sourcing the tool. It’s built on the amazing D3.js — built by The New York Times’ Mike Bostock — which is immensely powerful but also features a learning curve that’s proven a bit too steep for me. Today, that tool, Chartbuilder, is available for your use. (Here’s a chart of Apple’s stock price since May 3 that I made in about three minutes.)
Nieman Journalism Lab
Ingen kommentarer:
Legg inn en kommentar